Friday, September 30, 2016

"Choosing An Oscilloscope"

Oct 2016 Nuts&Volts Magazine features my article "Choosing An Oscilloscope" - and the cover art we shot here!


http://nutsvolts.texterity.com/nutsvolts/201610/?pg=1#pg1

MSR255 Data Logger helps identify leakages in vacuum chambers


MSR255 Data Logger helps identify leakages in vacuum chambers
Authors: Nic Piatkowski, PhD, Climeworks AG, Gabriela Zumkehr, MSR Electronics GmbH

Published in a German trade journal, October 2015

Mini data loggers are proving to be useful tools for recording and storing physical measurements in diverse fields of industry and science. As the present user report concerning MSR data loggers at Climeworks AG – an internationally recognized developer of CO2 collectors – shows, these small data recording devices are able to do much more than has been known to date with respect to their typical applications, such as monitoring transport conditions.

While CO2 has fallen into disrepute as a climate killer, it does not only have drawbacks. This gas is used as a protective atmosphere when packaging food and helps accelerate the growth of plants. With the innovative technologies of Zurich-based Climeworks AG, a spinoff of ETH Zurich, the gas is produced virtually CO2-neutral, using waste heat. With the CO2 collector, Climeworks has developed a technical solution that extracts highly concentrated CO2 from air with a low expenditure of energy. This “renewable” CO2 is the ideal raw material for many industrial applications, including synthetic automotive fuels such as Diesel, petrol and methane. The car manufacturer Audi, for instance, has also recognized the benefit of these CO2 collectors; it plans to integrate and test the world’s first industrial module of a CO2 collector in a synthetic fuel production plant.


What do the CO2 collectors do?
The Climeworks process is based on the cyclical adsorption and desorption of CO2 from ambient air. During the adsorption process, ambient air passes through a specially developed adsorber system, which contains a sorbent that binds the CO2. As soon as the sorbent is saturated with CO2, the process is switched to the desorption phase in which the sorbent releases the isolated CO2. For this purpose, it is heated to approx. 80-130 °C by means of low-temperature heat and exposed to a rough vacuum in a vacuum chamber. The company had such a vacuum chamber constructed for a new product line and tested it with respect to leakages and structural strength using a mini data logger.     


MSR255 Data Logger monitors vacuum


Climeworks selected a data logger of the type MSR255 by the Swiss measurement technology company MSR Electronics GmbH for the acceptance tests of the vacuum chamber. This compact miniature measurement technology laboratory has a large memory (2 million measured values) and an LC display that can be individually configured; it is ideal for flexible, on-site measurements – even under special ambient conditions. In its full version, this data logger is able to record up to five different measurements at the same time and to store their values. However, at Climeworks the MSR255 was used with an external temperature sensor and analogue inputs for connecting Climeworks’ own pressure sensor, which was placed inside the vacuum chamber. With the logger, the company was able to provide accurate information regarding the pressure ratios and pressure patterns for each time unit and, in particular, observe a pressure loss caused by leakage.


Leakages are quickly identified
For the acceptance test, at the manufacturer’s premises, the pressure within the vacuum chamber was reduced to approximately 1 mbar absolute. Temperature and pressure values were monitored throughout, to check the quality of the seal. The pressure was measured with a 2-wire/24 V pressure sensor with 4-20 mA output for a pressure of 0-1 bar absolute. It was powered by a laboratory power supply and connected with the 4-20 mA analog input port of the MSR255 data logger. The logger was programmed so that the 4-20 mA signal was rescaled directly into an output value of 0-1 bar (absolute).
The temperature of the vacuum chamber was measured with the integrated temperature sensor of the MSR255, which had been attached to the wall of the vacuum chamber. The measured values are analyzed by means of the MSR PC software, which delivers very meaningful measurement diagrams. The developments of the temperature and pressure values evident from this, as well as the known volume of the vacuum chamber, were used to determine the increase of the air mass in the chamber via the ideal gas law and thus the leakage rate was calculated. This practical example already shows that the miniature data loggers can be used profitably in versatile metrological application scenarios, saving both time and costs – the spectrum of applications ranges from logistics, through machine and transportation monitoring, to laboratory measurement technology, automotive test bench technology and even aerospace.

Thursday, September 29, 2016

Elevator Manufacturing Helped by ABI Electronics


Customer: Brazilian Elevator Manufacturing Plant


Problem:

-          New electronic cards are assembled by third party companies and shipped to elevator manufacturer in the south of Brazil.

-          The end of production test carried out by the automatic test equipment (ATE) is slow and gives little information about the fault location if PCB fails the test.

-          Operators have to follow traditional work instructions and instrumentation (PSU, scopes, multimeter) which is time-consuming and ineffective.

-          The test area became a bottleneck and PCBs are being scrapped when faults are not found quickly.

-          Similar problems being faced by manufacturer's offices in Chile, Argentina and Mexico which rely on R&D team in Brazil for advice.


Solution:

-          ABI distributor approached test managers earlier this year

-          Customer presented the situation above and showed interested in having the existing process replaced by SYSTEM 8 Modules and TestFlow

-          Manufacturer's test managers travelled to Sao Paulo to watch a demonstration from RCBI and to visit other ABI customers in the region

-          ABI introduced the following scenario to be implemented at the third party PCB manufacturer (CEM):

o   ABI hardware (BoardMaster) could be connected to an interface card (designed by mfr) populated with relays that would switch on/off according to logic patters output by the ATM module

o   The interface card would be linked to other modules (eg. AMS, MIS 4, VPS) and a test fixture (bed of nails) developed for most critical PCB designs

o   A sequence including Power Off and Power On tests would be set up using the TestFlow Manager.

o   A detailed report would be generated including any fault information. The report would be submitted to the R&D for analysis and operators could run a component level test to troubleshoot most expensive PCBs.

o   This setup could also be put in place by other elevator plants in Latin America


Outcome:

A group of 5 test engineers evaluated the proposal from ABI and presented the project to the company’s directors. An initial investment was approved and the order has been placed with ABI.


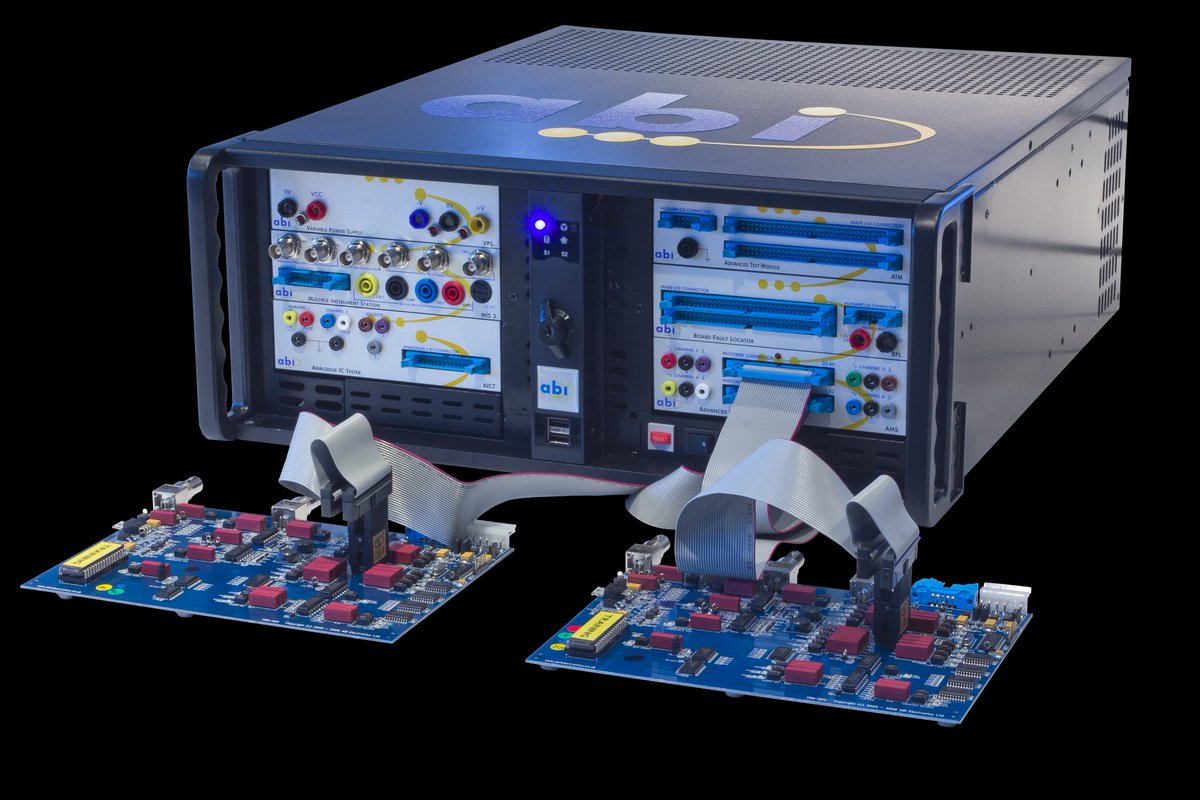
Products purchased: 2x 7 Bay BoardMaster with ATM, 2x AMS, AICT, MIS 4 and VPS plus accessories.


Tuesday, September 27, 2016

Using Your Oscilloscope's X-Y Display

(http://blog.teledynelecroy.com/2015/12/using-your-oscilloscopes-x-y-display.html)

Shown are some common Lissajous patterns in an X-Y display
Figure 1: Shown are some common
Lissajous patterns in an X-Y display
If you're fortunate enough to own an oscilloscope with X-Y display capabilities, you have a valuable tool at your disposal. From classic Lissajous patterns to state transition diagrams for today's quadrature communication systems, X-Y plots give us a window of the functional relationships between two waveforms.
Most users become familiar with the X-Y display by way of Lissajous patterns, where two sine waves are plotted against each other to determine their phase relationship. Figure 1 shows some commonly encountered Lissajous patterns. From them, one can gain a near-instant visual indication of how two sine waves relate in terms of phase.
X-Y display facilitates viewing of QAM signals in a constellation pattern
Figure 2: X-Y display facilitates viewing of QAM signals
in a constellation pattern
If the two sine waves are in phase with a 1:1 frequency relationship, the Lissajous pattern will be linear as in the top left. With the same frequency relationship but a 45° phase difference, an oval shape results (top center). A 90° phase difference produces a circle (top right).

With a 1:2 frequency relationship and the two sine waves 90° out of phase, the Lissajous pattern assumes the bowtie shape at bottom left. Two sine waves with a 1:3 frequency relationship and 90° out of phase look like the double-bowtie at bottom center. With these general shapes in mind, an oscilloscope can provide a general validation of phase alignment between two signals.

X-Y plots are useful in verifying phase alignment between two waveforms
Figure 3: X-Y plots are useful in
verifying phase alignment between
two waveforms
An oscilloscope with X-Y display facilities also allows you to look at quadrature amplitude-modulated (QAM) signals as a constellation pattern (Figure 2).  You can perform mask tests to ensure that different constellation patterns are within a specified tolerance. In Figure 2, the pattern at the center of the top row is externally clocked and is synchronous with the device. At top right, we see a pattern that is not synchronous; the redraw areas between the constellations are clearly visible.

X-Y plots also serve to verify alignment between waveforms. At left in Figure 3 are two waveforms that are exactly in phase. Even though these are complex waveforms, we can see a linear relationship between them in the X-Y plot. At right, however, the two waveforms have slid somewhat relative to each other in time, and we get an X-Y plot that shows the misalignment.

These are some of the ways that an oscilloscope's X-Y display capabilities can help in troubleshooting the relationships between two waveforms. Let us know of other ways you've used them!

Monday, September 26, 2016

Electromagnetic Compliance: Pre-Compliance Test Basics

Siglent just published and excellent EMC Precompliance article:  

                                                   
Today’s products are subjected to more standardized test requirements than ever before. These standards (UL, CE, and others) ensure consumer safety and add to the quality and dependability of products. But, these tests also add cost to the manufacturer, which is passed to the consumer. This is especially true with electronics. 

Any product that has the ability to generate radio frequency (RF) signals and is slated for commercial use is subject to meeting certain limits on the amplitude of radio frequency (RF) signals that it can produced. Unintended RF is typically referred to as electromagnetic interference (EMI) and measuring a products performance with respect to these limits is known as electromagnetic compliance (EMC) testing. 

These tests are mandated and enforced by government agencies (the Federal Communications Commission in the USA) that oversee the geography into which a product will be sold. They are also responsible for defining the test configuration (physical location, layout, distances, test equipment, and settings) as well as specifying the minimum performance of the product type. 

The primary goal for setting these limits is to ensure that products don’t interfere with the normal operation of existing products and broadcast channels (radio and TV, for example). Products that don’t meet these standards are not available for legal sale within the country and companies may have to halt sales, recall product, and/or pay fines if products are found to be non-compliant.

EMC testing can be self-certified. That is, a manufacturer can perform the testing and certify that they pass the limits set forth for their product. In practice, most companies send their products to a third-party test lab to perform the required testing. This is due, in part, to the special equipment and knowledge required to successfully perform EMC testing. 

An accredited third-party lab has the expertise and equipment to quickly and accurately determine the performance of a product vs. the government limits on that product type. Full compliance testing in a lab is ideal and highly recommended when you are confident that the product meets or exceeds the limits, but testing in a lab can be expensive. Standard rates currently hover between $1000 and $2000 per day and there can be additional difficulties scheduling time to get into the lab. Additional issues arise if the product fails. Every failed compliance test requires a fix and retest. If the first fix doesn’t work, another fix is applied, and the product is retested. This process continues until the product passes the testing requirements.  

Fortunately, there are test methods and techniques that can help minimize the amount of lab time that may be required to pass compliance testing. These pre-compliance test techniques can be implemented early in the design process and applied throughout the development cycle. Testing EMI during product development instead of after will lessen the overall cost and shorten the total development time. It will also deepen your understanding of the RF footprint of your product and allow you to make adjustments before the design is finalized, saving you time and money. The knowledge gained during these troubleshooting stages can be also applied to future designs.  


RADIATED EMISSIONS/NEAR FIELD:


Radiated emissions compliance testing involves measuring the RF power that emanates from a product over a specified frequency range using an antenna and a spectrum analyzer and comparing it to the standard limits for that product class.


Figure 1: A Siglent SSX3021X 2.1GHz spectrum analyzer.


Accurately measuring the radiation emitted from a product requires reduction of external RF sources like radio stations, radar, and Wi-Fi. Throughout most of the 20th century, outdoor testing sites located far from RF sources could be utilized. Over the past 20 years, the exponential increase in RF sources (Wi-Fi, Bluetooth, cell phones, and the like) have made these open air test sites (OATS) facilities practically extinct. Most compliance labs utilize special rooms (anechoic and semi-anechoic chambers) that minimize the amount of external RF. The device-under-test (DUT) is placed on a rotating stage atop a non-conductive table and the antenna orientation (height and rotation) can also be adjusted. This allows a complete survey of the emitted radiation from the DUT in three dimensions. A basic diagram of a common radiated emissions test is shown in Figure 2.  


Figure 2: A common radiated emissions compliance test configuration. 


Correlating the potential compliance performance of a DUT from data captured during radiated pre-compliance tests can be a tricky process. The environmental RF, reflections, and absorption can make repeatable measurements difficult at best and most organizations don’t have the budget to build and maintain a special chamber designed for the task. Shielded tents and fixtures can be used to minimize environmental RF and periodically measuring the environmental RF can help provide a clearer picture of the radiated emissions from your product, but near-field measurements are the primary method used to identify the potential problem areas of a design because the measurements are less prone to environmental effects and they are more convenient due to the smaller size of the probes.

The near-field probing technique involves using a loop or point probe connected to a spectrum analyzer. The two most common types of near-field probes available are magnetic (H) and electric (E) field probes. They are effective because they are fairly immune to environmental RF. During a test, the probe is placed close to the DUT and is slowly used to scan across different areas. The distance from the DUT varies, but less-than-a-half-inch is a good starting point. Scans can be performed at every step of the design process, including discrete circuit elements, traces, sub-assemblies, all the way up to finished products and enclosures. The most likely problem areas include cut-outs, seams, and gaps in metal enclosures, LCD/display ribbon cables, USB/LAN ports, and switching power supply circuits. While scanning, observe the analyzer and look for increased amplitudes on the display. Note the frequency bands with the most prevalent signals. These could be problematic EMI sources. Figure 3 shows commercial near-field probes and figure 4 shows an example of using a near-field probe and spectrum analyzer to determine problem areas of a design.


Figure 3: Siglent SRF5030 Near-Field Probe kit includes 2 loop and 2 point magnetic (H) field probes, cable, and adapter. Only the probes are shown.


Figure 4: Scanning a board using a Siglent SSA 3021X Spectrum Analyzer and an SRF5030 near-field probe.


CONDUCTED EMISSIONS:

Products that receive power by wires or cords to the national power distribution grid need additional testing. In most cases, this means any product that is connected to a wall outlet, but can include industrial connections as well. This is known as conducted emissions testing which involves measuring the RF energy that originates in the product and propagates down the power cord onto the power grid. This is important because excessive RF on the power lines can cause interference with AM radio and other broadcast bands. 


Conducted emissions testing requires a spectrum analyzer, two bonded metal plates that function as ground planes, and a Line-Impedance-Stabilization-Network (LISN). The LISN supplies power to the device-under-test (DUT) and diverts the RF from the DUT to the spectrum analyzer, where it can be measured. Additional transient protection and attenuation can be added to help minimize the risk of damage to the sensitive RF input of the analyzer. A typical conducted emissions setup is shown in figure 5.


Figure 5: Typical conducted emissions compliance configuration. A transient limiter and attenuator are recommended to protect the input of the analyzer.


The cost for emulating a fully compliant conducted emissions test setup is relatively low. This makes correlating pre-compliance data to expected compliance performance significantly easier than with radiated emissions.


IMMUNITY/SUSCEPTIBILITY:

In the US, compliance testing for consumer products focuses on maintaining the conducted and radiated emissions of a product. But, there is another aspect of compliance testing that we would like to cover. Products used for military and aerospace products in the US as well as many consumer products being sold in Europe and Asia will likely require immunity testing. These tests are designed to ensure that a product can operate correctly when it is in an environment that contains specific RF signals. Immunity tests can also be referred to as susceptibility testing, as the tests are determining if a product is “immune to” or “susceptible to” interference.

The basic configuration for immunity testing is shown in figure 6 below. An RF source is used to deliver specific RF power over defined frequency bands and the operation of the EUT is observed. The EUT should maintain normal operating functions throughout the test. 


Figure 6: A typical immunity test. Note that an RF absorbing chamber is used to contain the RF power and minimize the leakage into the environment. 


Note that the configuration of the test is very similar to a radiated emissions test, but instead of measuring the amount of radiated RF power from the EUT with a spectrum analyzer, the EUT is actually being radiated by RF power being delivered by an antenna and RF source. The RF absorbing chamber is also being used. This is to prevent the RF from escaping into the environment and causing issues with the world “outside” of the test lab. It is critical to stay below the published standards for unlicensed intentional radiators if you perform this test. At a minimum, you could cause disturbances with Wi-Fi or other networks nearby. Worst case, you could cause issues with radar or other systems that are critical to ensure the safety of people. Please be cautious and follow the regulations for your region.


CONCLUSION:

Products with the ability to produce RF energy need to be tested to ensure that they comply with government regulations. The two most common compliance tests radiated and conducted emissions tests. While companies may choose to self-certify, it is recommended to have a third-party lab perform compliance tests. But, third party labs can be expensive and scheduling time in the lab can be difficult.
Implementing in-house pre-compliance testing of near-field and conducted emissions test techniques at each stage in the design process can minimize the total development time for your products, lower the cost of design, and decrease the amount of testing on future products.

REFERENCES:

Basic Guidelines: Federal Communications Commission (www.fcc.gov)


Unintentional Radiators: Title 47, Part 15, Subpart B of the Electronic Code of Regulations for the USA 


Wednesday, September 21, 2016

5-in-1 SIG-101: PC-Hosted Test Scope With Signature Analysis


Scope/AWG/signature analyzer/VNA/ I/O in one box!

Today we introduced the Syscomp SIG-101 Signature Analyzer  - a PC-based two-channel 200kHz oscilloscope, sampling at 2MSa/s, that includes an arbitrary waveform generator, and an 8-bit digital I/O port.  Building on the CGR-101, its successful predecessor, the SIG-101 also adds calibrated signature techniques to the oscilloscope waveform display capabilities for quickly troubleshooting circuit boards. Unlike most PC-based oscilloscopes with 8-bit A/D sampling, the SIG-101 has an 11-bit A/D that gives eight times more detail, and the built-in 12-bit 200kHz arbitrary waveform signal generator can be used to create swept, stationary, or noise test signals, or provide PWM outputs.  The oscilloscope and waveform generator can be combined to provide Vector Network Analysis capability, yielding Bode plots that graph the frequency response of a circuit.


The Syscomp SIG-101 also provides calibrated signature analysis with a wide amplitude and frequency range. Signature analysis is a powerful technique for detecting faults on PCBs: an AC voltage is injected into the test point of a circuit board and the analyzer then plots the voltage and resultant current on an X-Y display.   This display is a ‘signature’ of the circuit operation, which can be compared against a known ‘good’ pattern or board. If the patterns do not match, the test board is defective. For example, when testing a node, a capacitor will show an ellipse, a resistor shows a straight line at an angle, a diode shows the characteristic exponential curve.   Signature analysis is popular in production test because it requires no understanding of the circuit operation, and so it can be used by unskilled technical personnel.   The Syscomp SIG-101 represents an advance over existing signature analysis instruments: it costs a fraction of existing signature analysis instruments, and the frequency range of the test signal is continuous, extended over a wide range, allowing a wider range of useful measurements. The test voltage and measured current are calibrated, so the results can be translated into accurate component values. Signature and other waveforms can be saved, retrieved, and compared.
All functions can be controlled via a USB2.0-connection from a computer running Windows, Linux, or Mac operating systems, using the open-source GUI software provided. The SIG-101 can be used for production test, education, or for general purpose measurements for field technicians and engineers.
Powered by an external 110VAC wall adapter switching supply, and made in Canada by Syscomp Design, the Syscomp SIG-101 is available now from stock from Saelig Company.

http://www.saelig.com/pr/sig-101.html

Tuesday, September 20, 2016

Need to Detect Drones in Realtime?


Remote-controlled aerial devices are becoming an increasing nuisance and security hazard.  The Aaronia Drone Detection System (ADDS) can discover the incursion of unwanted drones or other remote-controlled flying objects from RF transmissions, thus protecting privacy and insuring physical security. Detecting the real-time directional measurement of the radio emissions used for controlling drones, the ADDS system warns the user when drones are in the area and can send automatic alerts. The system’s detection range of up to several miles is better than the usable distance from the drone operator to the drone, and depends on the transmitter power of the drone system. The ADDS detection system can be used virtually anywhere: typical scenarios are the protection of residential areas, government and corporate buildings and sensitive commercial or industrial areas such nuclear plants.


The ADDS system is available in various configurations and consists of an Aaronia IsoLOG 3D antenna, a real-time Spectrum Analyzer (XFR V5PRO or RF Command Center) and a special RTSA Suite software plug-in. These all combine to make a 24/7 monitoring and recording system with continuous data-streaming of up to 4TB/day. The drone detection software’s intuitive layout combined with powerful tracking, trigger, and display options help in quickly identifying and tracking RF emissions from drones/UAV´s or other RF sources up to 20GHz. Each sector-antenna is displayed in real-time, indicating the exact direction the drone’s flightpath. Customizable software alarms or pop-ups can quickly alert the ADDS operator/user.

The ADDS system can be configured as a single-side or a multiple-side solution to suit the characteristics of the terrain to be monitored.  It is supplied with specialized Drone Detection Software and covers a frequency range from 9kHz up to a maximum of 20GHz. The system successfully operates at night or in fog and other bad weather conditions, and will even detect “disguised” drones flying between buildings, or among shrubs and trees.  The ADDS system allows for continuous monitoring and recording with high tracking accuracy.  A portable version is also available, operational within minutes, with 360 degree coverage. The system can also be used to track the location or movement of drone operators. 

Drones are rapidly becoming more than just an annoyance, and are perceived as a potential destructive force. The rapid proliferation of micro/mini UAVs is a growing potential threat to national and commercial security. Easy to make, cheap to buy, simple to fly, and hard to detect, commercially-available drones are one of the fastest evolving technological threats to military and civilian interests. A commercial drone reportedly alarmed the Secret Service in March 2015 when the aircraft flew too close to a golfing President Obama in Florida. And a man was detained in May 2015 for flying a drone near the White House. In Japan, a man landed a small drone on the rooftop of the Prime Minister 's office. This means that drone detection is rapidly becoming an essential security issue and not a luxury.

All of the ADDS configurations are available now from Saelig Co. Inc.  For detailed specifications, free technical assistance, or additional information, please contact Saelig (585) 385-1750, via email: info@saelig.com, or by visiting www.saelig.com


Details here:    http://www.saelig.com/product/drone.htm


Friday, September 16, 2016

Everyone's heard of I2C - but what's I3C??? MIPI???

EETimes recently wrote:

The MIPI Alliance has started work on a standard interface for touch screens using its emerging I3C interconnect announced earlier this year. MIPI Touch, described at a developer’s conference here, aims to simplify work for engineers who currently support a handful of proprietary approaches.

The interface includes a standard command set for relaying messages between the application processor and other touch components. It aims to replace a variety of approaches using I2C and SPI links the group claims are not well optimized for mobile systems

The spec, now in a draft to contributors, is expected to be ratified sometime next year. It is being developed by companies including Intel, NXP, Qualcomm, Samsung and Synaptics.

It’s not clear if potential users such as Apple and their vendors will support the effort. In the iPhone 6, Apple used a touchscreen controller from Broadcom and a line driver from Texas Instruments, according to a teardown by TechInsights. Apple is a contributing member of MIPI, but Broadcom is not a member.


Read on here:  http://www.eetimes.com/document.asp?doc_id=1330451


Wednesday, September 14, 2016

PicoScope 2000B shortlisted for Test Product of the Year at the European Elektra Awards!

Congrats to @picotech ! Great news: PicoScope 2000B has been shortlisted for Test Product of the Year at the Elektra Awards bit.ly/2crbauE


See the 2000 Series line-up here: http://ow.ly/Ad9s304cXF6

Tuesday, September 13, 2016

780 Handheld Video Test Instrument (300MHz)

780 Handheld Test Instrument (300MHz)

The Teledyne LeCroy 780 Handheld Test Instrument for HDMI® is a
battery-powered, portable video and audio generators and HDMI
analyzers that enable you to conduct quick, on-site verification testing
and troubleshooting of your HDMI system and analog video displays.
The 780 supports testing of HDMI 1.4b devices up to 165 MHz pixel rate
and up to TMDS character rates of 225 MHz with deep color.


The quantumdata 780 are equipped with both a reference HDMI source
and a reference HDMI sink interface allowing you to test audio, video
and HDMI protocols —HDCP, EDID, CEC & infoframes—of any type
of HDMI device: sources, repeaters and sinks.

You can use the 780 as pattern generators for calibrating your high
definition TVs. The 780 are equipped with a variety of standard patterns
and formats including deep color and HDMI 3D formats for routine video
pattern testing and calibration of high definition and ultra high definition
displays and TVs.

The 780's portability makes them ideal for your bench and for use in
the field. A color touch display makes the 780 instruments easy and
convenient to use and when testing a source device you can view the
incoming video image and metadata on the built-in LCD.


Because the 780 test instruments have both HDMI output and HDMI
input ports, you can test your HDMI cables and HDMI network with
splitters, extenders and switches even when already installed on site
using the Frame Compare feature.