Thursday, December 29, 2016

Intelligently controlled light and the potential of DALI 2.


DIAL GmbH’s blog recently had an interesting article on DALI1 & 2 (https://www.dial.de/en/blog/article/intelligently-controlled-light-a-look-at-the-potential-of-dali-2/)

The clear advance of the LED into all areas of lighting technology has led to major changes in the control of luminaires. What was controlled via dimmers or analogue 1....10 V interface a few years ago is now linked digitally to the central nervous system of the building. The standard for the control of luminaires is DALI (Digital Addressable Lighting Interface). Originally created to dim fluorescent lamps, this system has developed into an all-round tool for lighting. The triumph of the LED has also meant a real boom for DALI since LED luminaires provide the best technological conditions for digital control.
What can DALI do? And how does DALI function?

DALI is the most widely used luminaire interface in the control of architectural lighting. Anyone who deals professionally with light and lighting control cannot escape DALI. The standards were laid down in 2000 in the IEC 62386. There are now products developed by many different manufacturers available for a wide range of applications. The functions offered by these devices have increased significantly over the years. Multifunction luminaires with several color channels enable the direct control of any chromaticity coordinate. Depending on which primary colors the luminaire generates, color temperature and/ or saturated colors can be controlled absolutely or relatively. Multi-channel luminaires - with up to six output channels - can be operated without any complicated channel allocation. DALI emergency lighting systems can be monitored and tested easily. 


All these devices are standardized and classified in the DALI standard IEC 62386.102. The different types of devices  (device types 0-8) are defined in standards 201 to 209. For example type 6 focuses especially on LED, or type 1 on the properties of DALI emergency lighting devices. Data communication, sets of parameters and topology are also defined in IEC62386.


Since November a new version of this DALI standard has been available - Edition 2. DALI is expected to close the gaps in the existing standard and to enable better interoperability. While in the first edition only Control gear’s and general communication were described, DALI 2 opens up the world of sensor technology to manufacturers and users. Part 103 "Control devices" was added to IEC 62386. New types of devices in the sensors sector, such as push-buttons, light sensors, motion sensors or remote control interfaces, are now defined in the standard.


DALI Edition 1 functions according to the pure master-slave principle. That means that no control gear (slave) may ever communicate independently on the bus since this does not have any collision detection. The Master Control Device has to inquire about the status of a luminaire so that this may then reply with an 8-bit telegram. So it becomes very clear that comprehensive sensor functions are restricted since a master must continually inquire about the status of all the sensors. Until now this has only been possible with proprietary manufacturer solutions.

For BMS (Building Management Systems) access to the sensor functions is barred completely since there are also no standards for this. The extension of the standard, or rather its completion, in Edition 2 now makes it possible in future  to transmit control commands, operating data for the luminaire ballast and also sensor functions from and to devices of any manufacturer.

DALI 2: Which is the most important innovation?

For the first time DALI 2 now allows sensors to access the bus independently and communicate either with the master control device, luminaire ballast or other sensor control devices. The sensors therefore have the option of bus access control. The sensor telegram is defined as 24-bit and contains an address byte, instance byte and command code byte. Control devices can be addressed and grouped in 32 instances. However, there is a difference to other operating devices in that control devices can transmit group and address information. So, for the very first time, event-driven actions and logical links are possible and intended in the DALI standard . Control devices now have their own address area. That means that with DALI 2 64 ballasts and 64 sensor control devices can be operated on one line.

What does this mean for future applications? Imagine a multi-story office building which is fitted throughout with DALI-capable luminaires. On the different floors DALI multi-function sensors have also been fitted throughout. These sensors can, in the same way as luminaries, be allocated to zones within the room. This can be done very flexibly, so that the use of the building can be changed or adapted. When room zones are redefined, then the sensors move accordingly. Complex (re-)programming is no longer necessary and the lighting can be controlled efficiently, "out of the box", depending on the incidence of daylight and human presence in the room.

Superordinated building automation systems such as BACnet  (Building Automation and Control Networks) are also able to process the sensor information and optimize it with the data from other building technologies such as heating, ventilation, temperature. Central maintenance functions can monitor the status of lamps, energy consumption and display the status of these functions visually. The total automation of buildings thus becomes much simpler and more controllable. Let us take a small digression into the future of product design. It is possible to imagine the integration of sensors into luminaires, into control gears or even into an LED module.
How is compatibility ensured?

How can the intercommunication of DALI devices be ensured? How can we be sure that they are interoperable? With the DALI 2 standard the foundations are laid for future interoperability. For the very first time a standardized control gear is not controlled according to the classic master-slave principle. DALI 2 enables event-driven communication between the application controller and the control device. And of course this is downwardly compatible and parallel to the existing DALI 1 installation. 


Manufacturers of DALI components can of course test these themselves and compare the results with the IEC62386 or employ the services of a specialized testing laboratory such as DIAL. With the DALI 2 logo the manufacturer declares the conformity of his product with the standard. To enable validation the test results must in future be passed on to the AG DALI. For this purpose an online service is available which publishes all devices with DALI conformity in a product data bank. Designers and users can thus very quickly obtain an overview of the available devices of a particular type.  

LED-Warrior14U-DR USB to DALI Bridge (LW14U-DR)

Laplace Instruments Products: FaulTracker FTR


Laplace Instruments Products: FaulTracker FTR

A powerful fault finding tool for complex electrical systems.

The FTR FaulTracker is a recorder/monitor specifically designed to check the operation of electrical control equipment. It is ideal for the 'capture' of those frustrating intermittent situations where problems only occur briefly, but can have serious consequences.

The FTR can be connected to up to 16 points in the system to be monitored, the inputs accepting anything from low voltage DC to 265V ac without any adjustment. The FTR monitors these inputs in terms of ON/OFF status, and will record any changes (events) in these inputs with millisecond accuracy. The recording can be of many days or weeks duration  Subsequently, these events can be replayed, one step at a time either on the built-in display or on a PC via the included serial port and included Windows application software.

Click here for more details.

Wednesday, December 28, 2016

‘LOG Storm’ High-speed Digital Data Logger


-
affordable extended digital recording and data filtering capability


LOG Storm 2MS is an economical high-speed digital data logger for troubleshooting digital system buses. LOG Storm 2MS contains an 8Mbyte/2Msample memory buffer, enabling large bursts of data up to 20bits at 100 MHz to be sampled. A USB connection streams the collected data to an attached PC, enabling gigabytes of data storage. LOG Storm 2MS 's most useful feature is its data filtering capability, efficiently storing only relevant data.


Design engineers often use a logic analyzer for digital system debug, but they frequently report that this is unhelpful when problems result from a long sequence of combined software and hardware events. Logic analyzers cannot record sufficient depths of relevant data history to be useful. In contrast, LOG Storm 2MS is a dedicated hardware/software combination that can collect high-speed digital bus activity for periods of hours or even days, and extract specific functional events of interest, improving an engineer’s debug capabilities enormously.


Frederic Leens, Sales & Marketing Manager at Byte Paradigm (Belgium) comments: 'By customer demand, we have already addressed one of the most common digital debugging problems: the need to understand the history of events that lead to a bug – but now we have made it even more affordable!'


Most oscilloscopes and logic analyzers do not have the capability of recording hours or days of digital trace data. LOG Storm 2MS provides the high speed data sampling, large storage capacity, and pre-filtering necessary to extract useful, relevant digital bus traffic evidence to quickly solve complex system debug problems.


LOG Storm 2MS offers compact, easy-to-deploy data logging with huge storage capability, a high sampling rate and rich data storage qualification capabilities. Examples of use include: SPI message monitoring of specific slave select lines; continuous, filtered data packet header evaluation; long-term bus monitoring; in-lab development; on-site post-installation servicing for chip-to-chip communication emulation, IP evaluation, etc.
Made in Europe by Byte Paradigm, a leading embedded test equipment manufacturer, LOG Storm 2MS is available now at $599 - more details HERE.

Wednesday, December 21, 2016

The Fast Fourier Transform Spectrum Analyzer on your scope ...


FFT Spectrum Analyzers use DSP techniques to provide in-depth waveform analysis with great flexibility (tutorial): http://bit.ly/2iaG3YZ.  Ian Poole in Radio-Electronics writes:

A FFT or Fast Fourier Transform spectrum analyzer uses digital signal processing techniques to analyze a waveform using Fourier transforms to provide in depth analysis of signal waveform spectra. The FFT analyzer can provide information not available from swept frequency analyzers, enabling fast capture and forms of analysis that are not possible with sweep / superheterodyne techniques alone.

Advantages and disadvantages of FFT analyzer technology

As with any form of technology, FFT analyzers have their advantages and disadvantages:
    Advantages of FFT spectrum analyzer technology
  • Fast capture of waveform:   In view of the fact that the waveform is analyzed digitally, the waveform can be captured in a relatively short time, and then the subsequently analyzed. This short capture time can have many advantages - it can allow for the capture of transients or short lived waveforms.
  • Able to capture non-repetitive events:   The short capture time means that the FFT analyzer can capture non-repetitive waveforms, giving them a capability not possible with other spectrum analyzers.
  • Able to analyze signal phase:   As part of the signal capture process, data is gained which can be processed to reveal the phase of signals.
  • Waveforms can be stored   Using FFT technology, it is possible to capture the waveform and analyze it later should this be required.
    Disadvantages of the FFT spectrum analyzer technology
  • Frequency limitations:   The main limit of the frequency and bandwidth of FFT spectrum analyzers is the analogue to digital converter, ADC that is used to convert the analogue signal into a digital format. While technology is improving this component still places a major limitation on the upper frequency limits or the bandwidth if a down-conversion stage is used.
  • Cost:  The high level of performance required by the ADC means that this item is a very high cost item. In addition to all the other processing and display circuitry required, this results in the costs rising for these items.

Fast Fourier Transform

At the very heart of the concept of the FFT analyzer is the fast Fourier Transform itself. The fast Fourier Transform, FFT uses the same basic principles as the Fourier transform, developed by Joseph Fourier (1768 - 1830) in which one value in, say, the continuous time domain is converted into the continuous frequency domain, including both magnitude and phase information.
However to capture a waveform digitally, this must be achieved using discrete values, both in terms of the values of samples taken, and the time intervals at which they are taken. As the time domain waveform is taken at time intervals, it is not possible for the data to be converted into the frequency domain using the standard Fourier transform. Instead a variant of the Fourier transform known as the Discrete Fourier Transform, DFT must be used.
As the DFT uses discrete samples for the time domain waveform, this reflects into the frequency domain and results in the frequency domain being split into discrete frequency components of "bins." The number of frequency bins over a frequency band is the frequency resolution. To achieve greater resolution, a greater number of bins is needed, and hence in the time domain a large number of samples is required. As can be imagined, this results in a much greater level of computation, and therefore methods of reducing the amount of computation required is needed to ensure that the results are displayed in a timely fashion, although with today's vastly increased level of processing power, this is less of a problem. To ease the processing required, a Fast Fourier Transform, FFT is used. This requires that the time domain waveform has a the number of samples equal to a number which is an integral power of two.

FFT spectrum analyzer

The block diagram and topology of an FFT analyzer are different to that of the more usual superheterodyne or sweep spectrum analyzer. In particular circuitry is required to enable the digital to analogue conversion to be made, and then for processing the signal as a Fast Fourier Transform.
The FFT spectrum analyzer can be considered to comprise of a number of different blocks:
Block diagram of an FFT - Fast Fourier Transform spectrum analyzer shwoingt he various circuit blocks required
FFT Spectrum Analyzer Block Diagram
  • Analog front-end attenuators / gain:   The test instrument requires attenuators of gain stages to ensure that the signal is at the right level for the analogue to digital conversion. If the signal level is too high, then clipping and distortion will occur, too low and the resolution of the ADC and noise become a problems. Matching the signal level to the ADC range ensures the optimum performance and maximizes the resolution of the ADC.
  • Analog low-pass anti-aliasing filter:   The signal is passed through an anti-aliasing filter. This is required because the rate at which points are taken by the sampling system within the FFT analyzer is particularly important. The waveform must be sampled at a sufficiently high rate. According to the Nyquist theorem a signal must be sampled at a rate equal to twice that of the highest frequency, and also any component whose frequency is higher than the Nyquist rate will appear in the measurement as a lower frequency component - a factor known as "aliasing". This results from the where the actual values of the higher rate fall when the samples are taken. To avoid aliasing a low pass filter is placed ahead of the sampler to remove any unwanted high frequency elements. This filter must have a cut-off frequency which is less than half the sampling rate, although typically to provide some margin, the low pass filter cut-off frequency is at highest 2.5 times less than the sampling rate of the analyzer. In turn this determines the maximum frequency of operation of the overall FFT spectrum analyzer.
  • Sampling and analog to digital conversion:   In order to perform the analogue to digital conversion, two elements are required. The first is a sampler which takes samples at discrete time intervals - the sampling rate. The importance of this rate has been discussed above. The samples are then passed to an analogue to digital converter which produces the digital format for the samples that is required for the FFT analysis.
  • FFT analyzer:   With the data from the sampler, which is in the time domain, this is then converted into the frequency domain by the FFT analyzer. This is then able to further process the data using digital signal processing techniques to analyze the data in the format required.
  • Display:   With the power of processing it is possible to present the information for display in a variety of ways. Today's displays are very flexible and enable the information to be presented in formats that are easy to comprehend and reveal a variety of facets of the signal. The display elements of the FFT spectrum analyzer are therefore very important so that the information captured and processed can be suitably presented for the user.

More here:   http://bit.ly/2iaG3YZ

Tuesday, December 20, 2016

Using Wireless Modules Instead of a Do-It-Yourself Design

Martin Keenan (Technical Manager for Avnet Abacus) in Electropages (http://bit.ly/2h6Aby3) makes some good points about buying a ready-made radio module instead of designing a wireless block yourself.  Though his comments are aimed at the Murata range of modules, the concept applies equally to others like ours here.

433 MHz Modules

He writes: "As wireless connectivity is becoming the norm in all electronic devices, and even electrical appliances, the range of modules available on the market is expanding. There are many benefits to using a wireless module versus doing your own discrete design for any widely adopted protocol such as WiFi or Bluetooth.  While this has always been true for low volume designs, even high volume designs are now taking advantage of wireless modules (for example, Apple’s iPhone 7 was revealed to use a Murata WiFi/Bluetooth module in a recent teardown). Here are our top five reasons why modules offer a better solution.

Monday, December 19, 2016

TekBox TBMDA1 Modulated Wideband Driver Amplifier

The TBMDA1 modulated wideband driver amplifier is an inexpensive signal source for immunity testing of electronic building blocks and products. It is designed to be driven by the tracking generator output of spectrum analyzers. With its gain of 22 dB and 1dB compression point of +22dBm, it can boost the output power of a tracking generator up to 150mW over a range of 20MHz to 3GHz. The TBMDA1 is ideal for driving the Tekbox Near Field Probes in order to find the sensitive spot of an electronic circuit; or for creating electric fields up to 50V/m when driving the Tekbox TEM Cell TBTC1, 25V/m when driving the TBTC2 or 18V/m when driving the TBTC3. Test signals for immunity testing can be CW, AM or PM. Consequently, the TBMDA1 provides built in modulation capability to generate 1kHz AM or PM signals. In PM mode, the TBMDA1 can also generate a 217Hz Signal with 12.5% duty cycle in order to simulate mobile phone TDMA noise.
Application:
  • Pre-compliance RF immunity testing, driving Tekbox EMC probes or TEM cells
  • RF driver amplifier
  • General purpose wideband RF amplifier
TekBox TBMDA1 Modulated Wideband Driver Amplifier

Thursday, December 15, 2016

Diagnosing High-Tech Farm Equipment Is Simplified With Pico Automotive Kits From Saelig.


Maintaining gas and diesel powered farm equipment has become increasingly challenging. The operating condition of tractors and other farm machinery can affect the fuel efficiency and reliability, so maintenance is crucial for energy and financial savings. What is needed is a better, faster way to locally fix a problem that shuts agricultural equipment down.  For instance, it can take days for a repair technician to get out to the farm, diagnose a minor hydraulic sensor issue, order the part, and swap out the sensor, leaving the tractor – and the field - lying fallow.  Farmers often want to do more than just change his tractor’s oil - they’d like to repair their equipment themselves, equipment that is very expensive.  When a machine breaks or needs maintenance, farmers are reluctantly dependent on others, when they have been maintaining their own equipment since the plow.  And as the cost and hassle of repairing modern tractors has soared, the demand for older tractors with fewer digital bells and whistles has picked up - simpler machines that farmers can maintain themselves.

Pico AutomotiveKits make diagnosing agricultural vehicle problems simple, intuitive, and logical. They come with a variety of accessories to test and diagnose a multitude of vehicle components, with help and advice included in the PicoScope 6 software. 
The award-winning selection of Pico Automotive Kits work with any combustion engine and make it easier and faster to find and fix problems. The free PicoScope Automotive software package runs on any Windows computer to form a powerful diagnostic oscilloscope, battery tester, and vacuum/pressure tester - and also lets users quickly diagnose noise and vibration problems to head-off looming problems.  PicoScope comes with over 150 different tests, more than 2500 waveforms, and is safe to use with no risk to the vehicles or equipment, thanks to its non-intrusive testing methods.  PicoScope can test: injectors and fuel pumps, starter and charging circuits, batteries, alternators and starter motors, lambda, airflow, ABS and MAP sensors, electronic throttle control, CAN bus, LIN bus and FlexRay signals, compression test, cylinder balance, misfires, etc.

The Pico Automotive Diesel Kit, for instance, includes: current clamps, premium test leads, fuse extension leads, break–out leads, oscilloscope probes, a 10:1 attenuator, flexible back-pinning probes, multimeter probes, battery clips, automotive software CD-ROM, training resources DVD, a quick-start guide, a 6ft USB cable, all in a sturdy carry case - just add a PC to complete this versatile test tool.

Engines in farming equipment must be serviced to insure that they operate efficiently, producing fuel savings and horsepower increases that offer substantial savings in money and time. Pico Automotive Kits are the ideal tool for hands-on machine problem diagnosis.  Made by Pico Technology, Europe’s award-winning oscilloscope adapter manufacturer, Pico Automotive Kits are available from Saelig Company, Inc. their USA technical distributor. For detailed specifications, free technical assistance, or additional information, please contact Saelig 888-7SAELIG, via email: info@saelig.com, or visit http://www.saelig.com/category/ADE.htm


Wednesday, December 14, 2016

FM Demodulation / Detection Tutorial

Radio-Electronics recently had a useful article on FM demodulation.....

FM demodulation or detection involves changing the frequency variations in a signal into amplitude variations at baseband, e.g. audio. There are several techniques and circuits that can be used each with its own advantages and disadvantages.


Frequency modulation is widely used for radio transmissions for a wide variety of applications from broadcasting to general point to point communications.
Frequency modulation, FM offers many advantages, particularly in mobile radio applications where its resistance to fading and interference is a great advantage. It is also widely used for broadcasting on VHF frequencies where it is able to provide a medium for high quality audio transmissions.
In view of its widespread use receivers need to be able to demodulate these transmissions. There is a wide variety of different techniques and circuits that can be used including the Foster-Seeley, and ratio detectors using discreet components, and where integrated circuits are used the phase locked loop and quadrature detectors are more widely used.

What is frequency modulation, FM?

As the name suggests frequency modulation, FM uses changes in frequency to carry the sound or other information that is required to be placed onto the carrier. As shown below it can be seen that as the modulating or base band signal voltage varies, so the frequency of the signal changes in line with it. This type of modulation brings several advantages with it:
  • Interference reduction:   When compared to AM, FM offers a marked improvement in interference. In view of the fact that most received noise is amplitude noise, an FM receiver can remove any amplitude sensitivity by driving the IF into limiting.
  • Removal of many effects of signal strength variations:   FM is widely used for mobile applications because the amplitude variations do not cause a change in audio level. As the audio is carried by frequency variations rather than amplitude ones, under good signal strength conditions, this does not manifest itself as a change in audio level.
  • Transmitter amplifier efficiency:   As the modulation is carried by frequency variations, this means that the transmitter power amplifiers can be made non-linear. These amplifiers can be made to be far more efficient than linear ones, thereby saving valuable battery power - a valuable commodity for mobile or portable equipment.

Calculating the stresses on the knee when skiing

Downhill racer Thea Waldleben measures g-forces using MSR Data Loggers


What is the level of the acceleration forces that impact upon the knees of an alpine downhill racer while skiing? Thea Waldleben, the current Swiss Junior Champion in the downhill event, addressed this question in her “Maturaarbeit” (exam project). Using data loggers by the MSR Electronics GmbH Company, the athlete analysed the stress on and behavior of her knees while skiing under different conditions.
      

Thea Waldleben

Downhill racer Thea Waldleben. Image Source: Thea Waldleben The downhill racer from Udligenswil (LU) trains in the women’s squad of the Swiss-Ski Leistungszentrum Mitte and attends the Sportmittelschule Engelberg. The racer, who is sponsored by ski manufacturer Stöckli, achieved the following successes during the 2015/16 season, to name but a few:
  • Swiss Junior Downhill Champion U21
  • Swiss Junior Downhill Champion U18
  • Swiss Junior Super-G Champion U18
  • Swiss Junior Combination Champion U18

Thea Waldleben, who is also successful in the Super-G discipline, trains in the women’s squad of the Leistungszentrum Mitte Ski Alpin of Swiss-Ski and attends the Schweizerische Sportmittelschule Engelberg (SSE). This educational establishment certified by Swiss Olympic has made a name for itself as a talent showcase for ambitious young athletes and has already produced prominent athletes, in particular in the field of alpine skiing, including Olympic gold medallist Dominique Gisin and World Cup medallist Wendy Holdener. Within the context of her “Maturaarbeit” (exam project), Thea Waldleben, who is sponsored by Swiss ski manufacturer Stöckli, asked herself which stresses her knees are exposed to while ski racing.

MSR165 mini data logger measures g-forces in all three axes


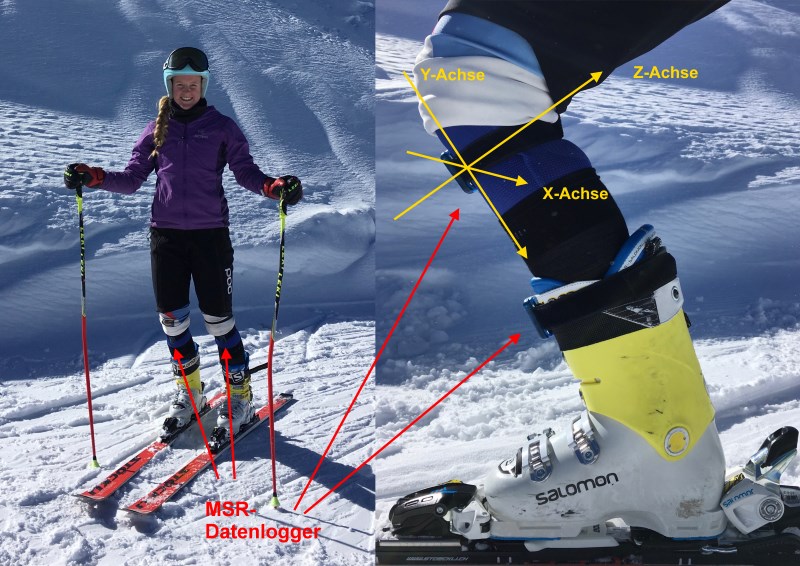
The athlete used the MSR165 data logger by Swiss measuring technology company MSR Electronics GmbH for her study. This data logger, which specializes in applications for recording oscillations, shocks and vibrations, is waterproof and merely the size of a thumb; therefore it is particularly suited for taking measurements on the body. The mini logger has a high-speed digital sensor, which is capable of taking up to 1600 measurements per second in the area of acceleration in all three axes. The MSR165 has a memory capacity of up to one billion measured values, depending on the configuration. By means of a sensor (with a working range of ±15 g or ±200 g), Ms. Waldleben was able to record which acceleration forces her knees are exposed to. As the housing of the data logger for the measurements on the body needed to have an even lower weight than the aluminum design housing of the MSR165 standard models, which are geared towards applications in industry, the ski racer was provided with a special design of the logger in a lighter SmartCase. The data loggers were attached by means of hook-and-loop tape directly below the knee joint on the tibial plateau, as well as above the ski boot.

Taking the measurements


Left: Position of the data loggers on the knee of the skier, both sides. Right: Detailed view of the position of the MSR data loggers. Image Source: Thea Waldleben All measurements were taken while freestyle skiing without cornering or in the gates when cornering. The different measuring blocks took place on the same day within a short time period. The pistes were selected according to their properties and condition with respect to gradient and uniformity to ensure that the turns are comparable. Several measurements were taken under different influencing factors to measure and evaluate both the behavior of the athlete’s knees in the x, y and z-axis and the average value. During the tests, the stress on the knee while skiing with different types of skis (slalom and giant slalom), under changed piste conditions and under the influence of the ski boot hardness were analyzed. Ms. Waldleben worked with a frequency of 100 measurements per second in all three directions in order to identify abruptly changing stresses on the knee.

Brief analysis of the measurement results


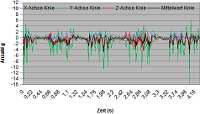
Measurements on the knee with closed ski boot buckles. Image Source: Thea Waldleben Thea Waldleben’s measurements indicate large g-forces, particularly in the y-axis. The smaller the hardness flex of the ski boot and the softer and more unsettled the piste conditions, the more agitated the knee behaves in all directions of movement and the stress increases. While freestyle skiing, the stresses measured on the knee were on average up to three times the body weight. In specified radii during the slalom and giant slalom even larger forces occurred, which were measured at two to three times this value.

Countering the risk of injury when skiing


Knee injuries frequently occur while skiing. In order to train in a preventive manner and to live up to the large measured forces, particularly in racing, it is very important to train the knee stability in all directions of movement. Pure strength training alone does not suffice. The training must be very specifically geared towards these rapidly changing maximum forces. This can, for instance, be trained by means of exercises on a moving base both with and without weight load or when running on a slackline.

MSR loggers are here!    http://www.saelig.com/category/MFR00058.htm      

Monday, December 12, 2016

Festive Greetings!

We value our relationship with you and look forward to working with you in the coming year.
Have a wonderful Holiday Season and a Happy, Prosperous and Blessed New Year.


Wednesday, November 30, 2016

Highlighting Code Mercenaries: USB Interface ICs That Need No Drivers!

Easy-use USB Interface ICs that need No Drivers!


Warrior ICs from Code Mercenaries are a family of universal I/O controllers for USB that handle all USB’s complex protocol details. No Windows software drivers are needed since Warrior ICs appear as HID Device Class (Human Interface Device). This means that Warrior ICs are controlled without screen-prompting for additional software - system drivers allow access to Warrior ICs directly from application programs. A Linux driver is also included.
Controlling Warrior ICs from your software is very simple. For Windows (XP, 2K, Vista) you can use any standard programming language to access the libraries, including Visual Basic. For MacOS X, support includes a software library which even allows access via AppleEvents™. Want to make a FileMaker™ solution to open a cash drawer, for instance? Easily done with IO-Warrior!
Code Mercenaries has been a supplier for industrial input device and peripheral manufacturers since 1998. 
The keyboard/mouse controller family KeyWarrior, and the mouse controller family MouseWarrior serve as basis for a large number of industrial input devices, such as products for the disability market and other specialty input devices.
The joystick controller family JoyWarrior serves a broad range of customers from industrial machine/vision control, professional and semiprofessional simulator control, to hobby and model building. Joystick/mouse hybrid controllers MW24J8 and MW24H8 make good options for front panel design – they are switch selectable to work as a mouse or joystick allowing both cursor control and data input via a joystick.
JoyWarrior24F8 is a low cost three axis acceleration sensor. With its small size and simple USB connection, it opens a lot of new application options. The MouseWarrior24F8 variant of this sensor is a mouse replacement that needs no surface for operation.
Applications for the IO-Warrior universal USB I/O controllers are very diverse. Only the number of pins and the data rate limit the use of IO-Warrior. It is used in laboratory setups, test equipment, as well as in hobby projects or full scale device production - either as the core of a device or just the USB interface.  IO-Warrior chips control robots and telescopes, perform quality control on production lines, take measurements in labs, control switches, and displays in front panels or simulator cockpits, or work as the USB interface in many kinds of manufactured products.
SpinWarrior is a family of rotary encoder controllers with USB interface. Variants allow from 3 to 6 encoders to be USB-connected, and are suitable for motion control, measurement, or human interface applications.
Recently, Code Mercenaries started developing and manufacturing products for LED lighting applications, delivering maximum efficiency and maximum life cycle to match the potential of modern LED technology.

Tuesday, November 29, 2016

Phase Locked Loop Tutorial | PLL Basics

The UK site Electronics Notes recently posted a helpful tutorial about PLLs (Phase-Locked Loops).

Phase locked loops are used in many RF systems: radios, as FM detectors as well as within frequency synthesizers that form the local oscillator in radio receivers. Here's a video introduction to their design and use.


PLLs are a key electronics building block for "locking" on incoming frequencies. They consist of a phase detector, voltage controlled oscillator and a loop filter as well as a reference signal source. Within the phase locked loop, the incoming reference hits the phase detector along with a signal from the PLL voltage controlled oscillator. A signal proportional to the phase difference between the two is generated and this is passed through a loop filter to remove unwanted signals. The resulting error signal is applied to the input of the voltage controlled oscillator with the effect that the phase between the reference and the VCO signals is reduced. Eventually  a steady fixed phase difference is reached. At this point the phase lock loop is said to be in lock and the frequency of the reference and VCO are exactly the same.

Using the basic phase locked loop, it is possible to achieve a wide variety of functions, but possibly they are most widely known for their use in frequency synthesizers. Here they enable a single highly stable frequency source to be used to generate a host of other frequencies, all with the same accuracy as the reference.

This phase locked loop tutorial gives all the basics required for an understanding of PLL technology.

Associated website: https://www.electronics-notes.com

Monday, November 28, 2016

Study: Ice Cream For Breakfast Boosts Brain Performance - Really!!

http://cwphilly.cbslocal.com/2016/11/23/study-ice-cream-for-breakfast-boosts-brain-performance/?cid=facebook_CBS_Philly


All the years of your parents saying “NO” to ice cream for breakfast may have actually stunted your brilliance.

According to The Telegraph, a new study performed by Yoshihiko Koga, a professor at Kyorin University in Tokyo, revealed that eating a certain amount of ice cream immediately after waking up in the morning can actually make you smarter.

No, you did not misread that!

According to the study, test subjects who indulged in ice cream immediately upon waking up and right before participating in a series of computer exercises had an increased reaction rate and were better able to process information. In order to rule out whether or not the brain was just shocked to a higher level of performance, the same test was done with regular ice-cold water, but the results did not compare.

According to The Guardian, a similar test performed back in 2005 by researchers at the Institute of Psychiatry in London revealed that one spoonful of ice cream gives your brain the same type of pleasure as winning money or listening to your favorite music.

For all you ice cream lovers out there, I’m sure you probably didn’t need science to tell you all of this.

Tuesday, November 22, 2016

The Best Handheld Spectrum Analyzers in the World!

6GHz Spectrum Analyzer PSA Series 5 from AIM-TTi & Saelig

AIM-TTi Series 5 Models from Saelig are available in 3.6GHz and 6.0GHz versions: handheld format with bench-top instrument-quality features. (www.saelig.com/pr/psa5series.html) 
The PSA3605 and PSA6005 fit comfortably into the hand and provide more than 3 hours of operation from each charge of the built-in lithium-ion battery.
Despite their compact dimensions, these analyzers incorporate a large high resolution color TFT display with touch screen control. The Series 5 is all-digital from the second IF onwards. This enables it to offer a full range of RBW/VBW (resolution bandwidths/video bandwidth) settings, multiple detector modes, and advanced features such as waveform demodulation and automatic measurements. The large 4.3” TFT color touch-screen provides a high resolution display, and an intuitive menu system that makes set-up fast and easy.

Watch this video and see for yourself! 


Monday, November 21, 2016

Real-time Control Drives Efficiency In Dry Bulk Handling Operations

Dry bulk cargos have to be loaded and unloaded quickly, efficiently, cost effectively and safely if shipping operations are to be profitable. The processes have long been mechanized, but by harnessing the power of computers to monitor the handling equipment, operational performance can be improved, scheduling for maintenance can be optimized and billing of customers can become automated. 


Fifty years ago ships were loaded and unloaded manually, so each port employed a small army of strong men who worked long and hard as soon as a ship came in. But nevertheless the handling operations protracted and so the ships were in harbor for extended periods. It is also worth noting that back then, health and safety legislation was virtually unknown and it was practically impossible to accurately account for the whole cargo.

However, dockside operations have long since changed for the better and even in developing countries harbors now bristle with cranes, elevators and loaders.

There is a simple rule that drives the development of such technologies – a ship at sea is earning its owners money; a ship in port is costing its owners money. Therefore shipping companies drive harbor operators to constantly improve their services and will transfer their loyalty to new docks if necessary. Quite simply, rapid loading and unloading are critical to the success of a shipping company and so dockside technology continues to develop to provide ever more speed and efficiency.

So, from manual operations, cranes, elevators, augers and loaders were developed, each one suited to a handling a different product - grain, coal, gravel or chemicals. While these were motor driven, they were controlled by human operators – and no matter how skilled the operators became, they had no real way of telling if they were optimizing processing and working efficiently. Then computers were brought in to automate the calculations and decision making and efficiency took a turn for the better; further, the computers could automatically collect operational data and convert it into commercial information for billing customers.

Today, another new generation of technologies is emerging and it is taking bulk cargo handling operations to new levels of efficiency, accuracy and flexibility. Put simply, robustly built sensors are being installed on dockside handling equipment; these constantly measure operational parameters of the machinery in ‘real time’ and feed live information back to a controlling computer, which can adjust operations on the fly so that efficiency is maintained. Further, all this data can be collated to provide billing information, and analyzed to determine how much work the machinery has done so that pre-emptive maintenance can be scheduled for minimal disruption to normal operations.

Unloaders come in a number of different designs, each suited to different materials. The core technologies include bucket wheels, flighted vertical conveyors and elevators, augers, horizontal belt conveyors and pneumatic systems. The mechanical principles of each of these are self-explanatory, but it is essential that control and monitoring of this equipment are maintained at all times to both ensure trouble-free operation and to calculate the weight of cargo being unloaded.
New sensors

The fundamental parameter to be measured is load (which can also be called weight or mass). The weighing scale was invented in ancient times, but is of no use in modern bulk handling operations; a load cell is required. This is an electronic sensor (in a robust housing if it is to be used in a harsh working environment) that constantly sends a signal to a remote computer proportional to the load being experienced at every moment in time.

As such it is simple to see that a load sensor is very useful on a crane; each load is weighed and the figures added up to give the total amount of cargo lifted.

However a load cell is not appropriate on a conveyor, auger, or other equipment that works by constantly having a quantity of cargo ‘in flight’. The amount in flight will be approximately constant, and the duration of the operation will determine the total amount of material handled. For this type of handling system you measure the torque of the motor’s drive shaft.

Torque is in effect a measure of the amount of power being transmitted in a rotational direction. A simple example that aids understanding is riding a bike: to accelerate or go uphill you need to pedal harder – or apply more torque via your leg muscles. The same principle applies with conveyors, augers, etc; the more heavily loaded they are the more power the drive motor needs to supply and therefore the total amount of power supplied over time is proportional to the total load handled.

It is increasingly common to fit torque and/or load sensors to handling equipment to obtain a real time measurement of their performance. They constantly feed information to the control computer, which can then adjust machine settings to optimize operations. The computer also collects the data for commercial purposes and maintenance planning.

As noted earlier these sensors are mounted inside a strong housing so that they can withstand the rigors of dockside life. Significantly they must transmit their data back to the control computers; the normal way to do this would be with electrical wiring, but that could not be expected to last long in the demanding environment of a busy port. One solution would be to use armored cable and to route via the most benign areas; however a better solution is wireless transmission of the signals.

Now, with over 20 years of research and development into digital non-contact torque monitoring, Sensor Technology UK Ltd is at the forefront of an important enabling technology. Its TorqSense transducer is based on the patented technology of measuring the resonant frequency change of surface acoustic waves (SAWs) generated by rotating shafts. It's a proven technology that has solved torque measuring challenges in a host of industries.

TorqSense torque sensors use two tiny SAW detectors made of ceramic piezoelectric material containing frequency resonating combs. These are securely mounted onto the drive shaft at a 90 degree angle to one another. As the torque increases the rotating shaft twists very slightly along its length which causes one comb to expand and the other to contract in proportion to the torque being experienced.

An adjacent pickup device emits radio waves, using the unrestricted 2.4 GHz waveband, towards the SAWs. The combs reflect them back, but because one comb is expanded and the other is contracted they return at two different frequencies. The difference in frequency of the reflected waves is proportional to the torque at any moment in time. This arrangement means there is no need to supply power to the SAWs, so the sensor is non-contact and wireless.

In reality, TorqSense measurement together with the digital outputs it offers is often the only practical way to measure torque in a demanding working environment. And once you are collecting torque data this way and have fed it into a computer, you are well on the way to sophisticated real-time control of complex processes.

Originally developed to solve a particular challenge in the automotive industry, TorqSense is now widely used throughout a range of industries including many bulk solid handling operations, liquid pumping applications, in mixers, in the nuclear industry, for testing aerospace components and running drug trials. It is applicable to all sizes of torque measurement tasks, from dispensing minute amounts of active pharmaceutical ingredients, through stirring industrial quantities of cook-chilled curries, to modelling storm and flood water flows –and indeed monitoring the tonnage of bulk solid cargo loading and unloading.

This innovative method of measuring torque is bringing distinct advantages to handling dry bulk products. A process that was once regarded as very difficult to monitor can now reap the same benefits as many other industrial processes, enabling operations to be optimized so that the highest levels of productivity can be achieved at the lowest cost.
Torque and load

Once TorqSense was fully developed, Sensor Technology found itself very busy working on project after project. Because torque is a fundamental parameter, it is used in many situations across the full spectrum of industrial sectors, so Sensor Technologies could spend one day talking to bakers about dough mixing, the next at a pharmaceutical plant dispensing active ingredients to microgram levels of accuracy, a third day working on a quarry conveyor or a dredger, and then move onto a dockside crane application, a robot arm or an electric vehicle drive.

In fact the company was so busy that it could not find time to develop its next idea until about five years ago. It was only logical to adapt the RF technique for use with straight-line load monitoring, such as is required by cranes and hoists as they lift cargo to and from ships. This would bring the wireless advantages to all types of bulk solid handling plant and allow all cargo handling techniques used in any given situation to be monitored by the same system, which would lead to significant savings in management time and costs as multiple reports do not have to be integrated.


It is notable that while LoadSense can measure any straight line load, can be scaled to work with any size of force and works horizontally and diagonally as well as vertically, it was actually developed for a bulk minerals application (of sorts). In fact it was first used to weigh multiple loads of stone being carried as an underslung cargo by helicopter. The stone was being used to build hikers’ paths in the UK’s most visited National Park, the Peak District. For airborne applications, LoadSense is integrated with a GPS (global positioning system) for pinpointing drop zones and totalizing flight distances.

The modern world requires rapid and efficient transportation of goods from continent to continent. As well as speed of handling, accurate records are also essential. TorqSense and its sister product LoadSense allow real time data to be collected, constantly updated and instantly converted into the critical information required for efficient logistics.