(http://blog.teledynelecroy.com/2015/12/using-your-oscilloscopes-x-y-display.html)
 |
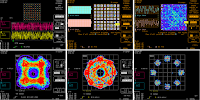
| Figure 1: Shown are some common Lissajous patterns in an X-Y display |
Most users become familiar with the X-Y display by way of Lissajous
patterns, where two sine waves are plotted against each other to
determine their phase relationship. Figure 1 shows some commonly
encountered Lissajous patterns. From them, one can gain a near-instant
visual indication of how two sine waves relate in terms of phase.
 |
| Figure 2: X-Y display facilitates viewing of QAM signals in a constellation pattern |
With a 1:2 frequency relationship and the two sine waves 90° out of phase, the Lissajous pattern assumes the bowtie shape at bottom left. Two sine waves with a 1:3 frequency relationship and 90° out of phase look like the double-bowtie at bottom center. With these general shapes in mind, an oscilloscope can provide a general validation of phase alignment between two signals.
 |
| Figure 3: X-Y plots are useful in verifying phase alignment between two waveforms |
X-Y plots also serve to verify alignment between waveforms. At left in Figure 3 are two waveforms that are exactly in phase. Even though these are complex waveforms, we can see a linear relationship between them in the X-Y plot. At right, however, the two waveforms have slid somewhat relative to each other in time, and we get an X-Y plot that shows the misalignment.
These are some of the ways that an oscilloscope's X-Y display capabilities can help in troubleshooting the relationships between two waveforms. Let us know of other ways you've used them!


No comments:
Post a Comment